
Make better commodity decisions in minutes, not months
AnalystHQ unifies market data, infrastructure maps, and on-platform research into an actionable analytics workspace—so your team replaces spreadsheets with living intelligence.


Why AnalystHQ
Fewer spreadsheets. Better intelligence.

Instant outlier detection
Arora Indicators flag anomalies across futures, options, volatility, positioning, and fundamentals.
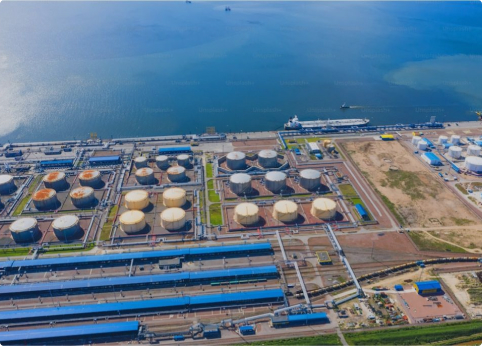
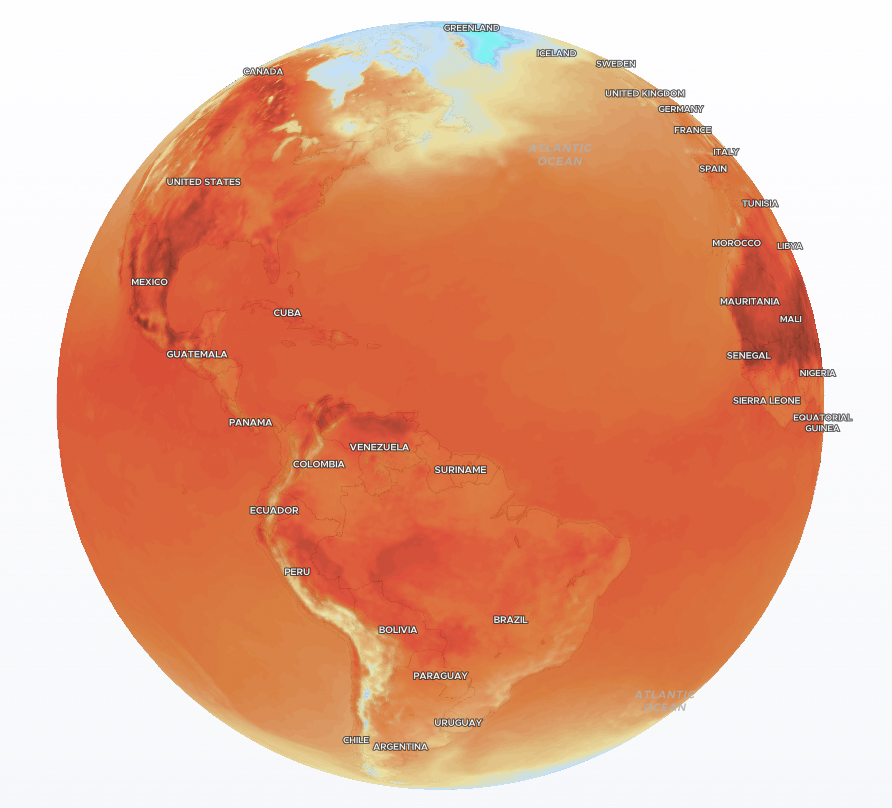
3D Analytics Studio
Interactive infrastructure and trade datasets—global LNG projects, pipelines, power plants, and port-level vessel activity—stitched into your price views.
On-platform research
Mobius analysts publish concise market reports you can pin directly to dashboards.
Custom to your workflow
Build analytics blocks once, save as views, and permission to teams.
Audience-tailored use cases

Energy E&Ps & Non-ops
- Monitor basis spreads, netbacks, and hedge performance in real time.
- See storage, pipeline, and rail options alongside maintenance events.
- Pin weekly Mobius market notes for regional driver context.
- Use 3D maps to visualize transport constraints and new infrastructure.

Industrial & Manufacturing
- Track feedstock and power price drivers impacting cost of goods.
- Monitor infrastructure bottlenecks that could disrupt operations.
- Access metals and materials fundamentals in one workspace.
- Overlay weather and macro data to anticipate supply chain risks.
.webp)
Capital Providers & Advisors
- Conduct faster due diligence with integrated price, fundamental, and infra data.
- Use Arora Indicators to flag market anomalies for investment committees.
- Access historical datasets for trend analysis and backtesting.
- Share curated dashboards with clients via permissioned URLs.
.webp)
Utilities & Regulated Entities
- Oversee portfolio performance with market, flow, and infra integration.
- Monitor regional demand/supply dynamics for proactive risk signaling.
- Present board-ready visuals with live, refreshable data.
- Track compliance-sensitive datasets with role-based access.
Key capabilities
1. Analytics Dashboards
- Build, save, and share custom dashboards per commodity, basis, or portfolio.
- Add Attribute Scores for quick anomaly spotting.
- Pin internal notes and Mobius research blocks.
2. Infrastructure Mapping (3D Studio)
- Global layers: LNG facilities, gas & oil pipelines, power plants.
- Near realtime trade flows across ~1,400 ports and chokepoints.
- Overlay flows with price spreads and fundamentals to explain moves.


3. Market & Macro Data
- Prices & curves, volatility, COT/positioning, FX, weather, metals fundamentals, and curated EIA datasets (STEO and more).
- Timeseries history for trend analysis and backtesting.
- Export data and visuals (CSV, image, and linksharing).
4. Collaboration & Governance
- Save views to user profiles; permission per individual or team.
- Share custom URLs for specific views with audit trails.
- Rolebased access, SSO, and granular data entitlements.
Data coverage
Ask us for the detailed data dictionary and source list tailored to your commodity stack.
Energy
- Crude & refined products
- Natural gas & power
- LNG
Metals & Materials
- Selected fundamentals and price drivers
Macro
- FX
- Rates
- Positioning indicators
Government & Public
- Integrated EIA series
- STEO
- Selected customs/port stats
Proprietary Indicators
- Arora Indicators
- Curated composites
- And annotated research

ROI at a glance
Consolidate multiple subscriptions into one decision workspace.
Save analyst hours previously spent wrangling spreadsheets and static decks.
Improve speed-to-insight for better hedging, sourcing, and commercial decisions.
FAQs
How often is data updated
Key series update intraday or daily, depending on source; STEO and other government series follow their official cadence.
How far back does history go?
Varies by dataset; price histories and selected EIA series extend back multiple decades. Ask for the data dictionary for specifics.
Which EIA datasets are included?
A curated set across production, consumption, inventories, imports/exports, and STEO outlooks—mapped into dashboards and models.
What’s different vs. other platforms?
Customization, integrated infra + flows + prices in one canvas, Arora Indicators for quick anomaly detection, and onplatform Mobius research.
Can we export charts and data?
Yes—CSV exports, image downloads, and shareable links with permissions.
Do you replace our analysts?
No. AnalystHQ augments analysts so they do more impactful work, faster.
What’s the typical onboarding time?
During beta, you’ll have access immediately. Most teams stand up first dashboards in a day.
How is our data secured?
Encryption in transit/at rest, SSO, and rolebased permissions. Tenant isolation and audit logging by default.
How frequently do you add new data sources?
Continuously. We maintain a roadmap and add sources based on user demand.