
August 27, 2026
Quick answer: Value at Risk (VaR) estimates the maximum loss a commodity portfolio is expected to suffer over a defined time horizon at a stated confidence level — for example, a 95% one-day VaR of $2 million means losses should exceed $2 million on only about one trading day in twenty. It turns diverse exposures into a single, comparable risk number.
Commodity portfolios mix physical positions, swaps, options, and basis exposure across locations and tenors. Value at Risk exists to compress that complexity into one figure a treasurer or board can act on. It answers a specific question — how bad could a normal bad day be? — and does it in dollars rather than in barrels, therms, or greeks. Used well, VaR frames limits and capital; used carelessly, it lulls a desk into ignoring the tail it explicitly excludes.
What does Value at Risk actually measure?
VaR has three inputs: a time horizon (one day, ten days), a confidence level (commonly 95% or 99%), and the resulting loss threshold in currency. A 99% ten-day VaR of $5 million means that, over a ten-day window, there is a 1% probability of losing more than $5 million from the portfolio's market moves. Crucially, VaR describes the threshold of the tail, not the size of losses beyond it — a distinction that matters enormously in commodities, where price distributions have fatter tails than a normal curve implies.
How is VaR calculated for a commodity portfolio?
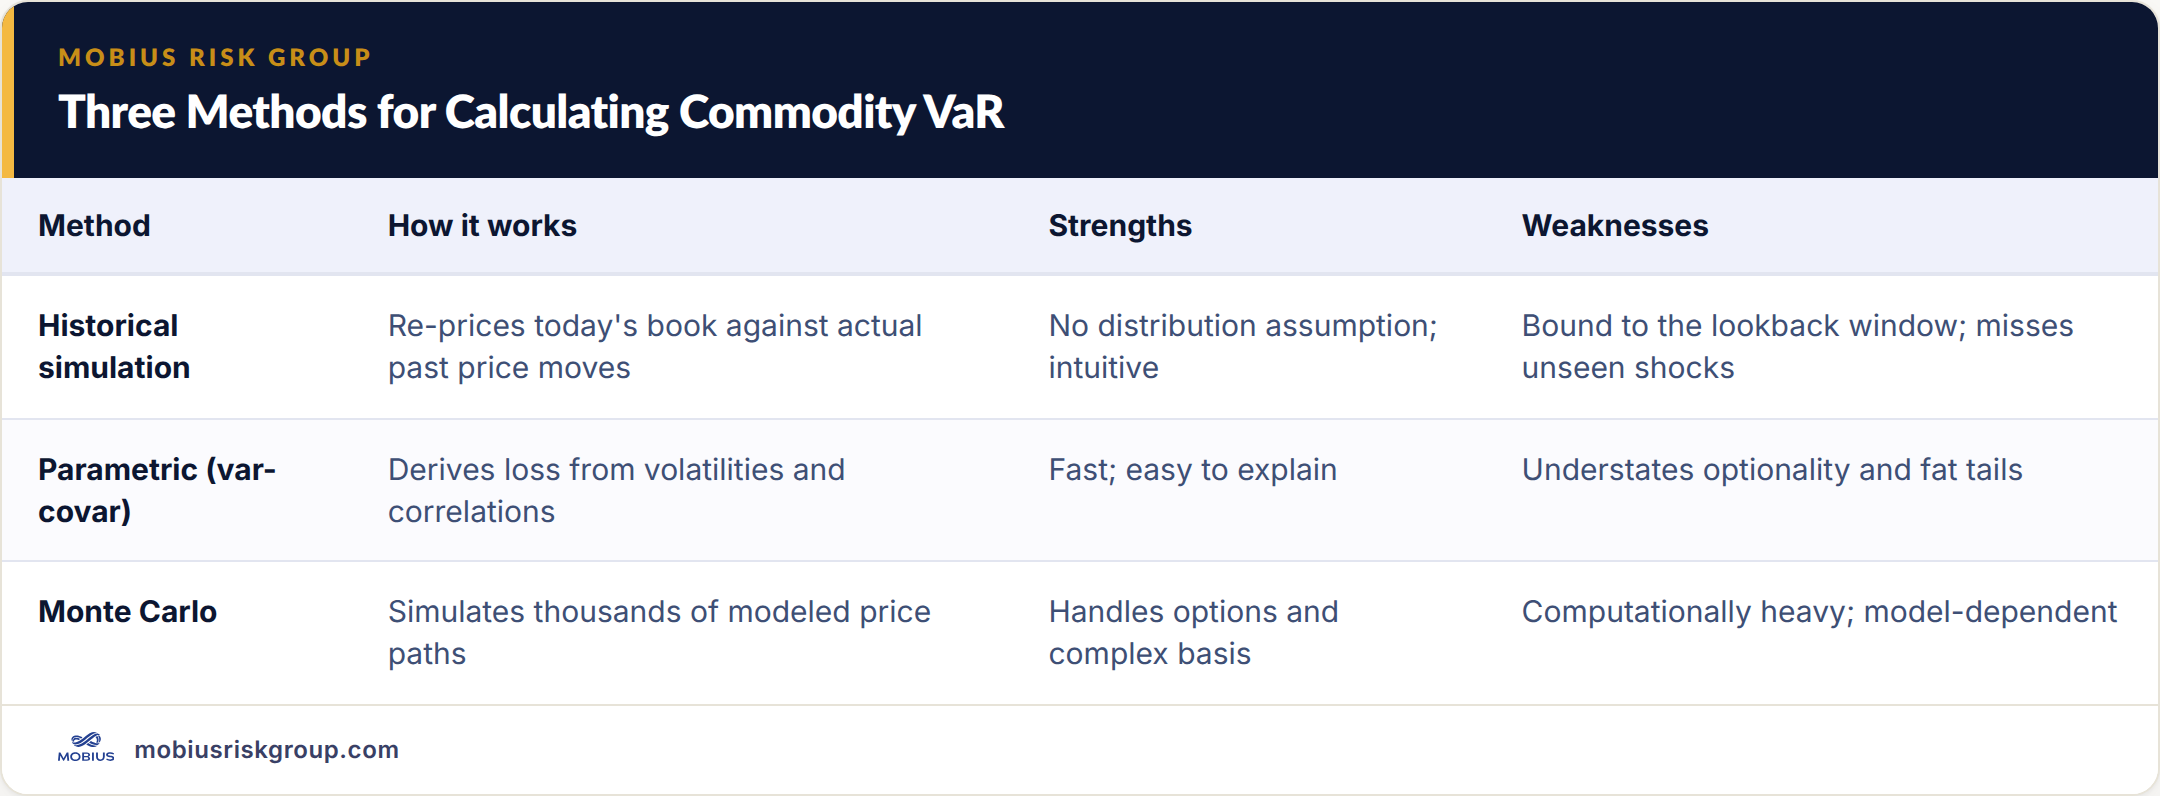
Three methods dominate. Historical simulation re-prices the current portfolio against a window of actual past price moves and reads the loss at the chosen percentile — simple and free of distribution assumptions, but anchored to whatever the lookback window happened to contain. Parametric (variance-covariance) VaR assumes returns are normally distributed and derives the number from volatilities and correlations — fast, but it understates risk when positions are optionful or markets are non-normal. Monte Carlo simulation generates thousands of random price paths from a specified model — the most flexible for options and complex basis, and the most computationally demanding.
What are the limits of VaR in commodities?
VaR is a threshold, not a worst case. It is silent on how large losses become once the threshold is breached, and it assumes the recent past is a fair guide to the near future — an assumption that hurricanes, pipeline outages, and geopolitical shocks routinely violate. Correlations that hold in calm markets can snap to one in a crisis, collapsing the diversification VaR credited you with. This is why VaR should never travel alone: it is paired with expected shortfall (the average loss beyond VaR) and stress testing against specific scenarios.
How should a risk team use VaR day to day?
Treat VaR as a governance instrument, not a forecast. Desks set position limits in VaR terms so exposures across products are comparable and additive. Management tracks VaR against an approved risk appetite and investigates breaches. Boards use the trend to see whether risk is rising faster than the business. The number is only as good as its inputs, so a credible program back-tests VaR against realized P&L and complements it with the scenario analysis VaR cannot provide.
Three Methods for Calculating Commodity VaR
Related reading: a commodity risk management framework for CFOs; how to choose a commodity risk analytics platform; how much of your exposure to hedge.
Frequently asked questions
What is a good VaR number?
There is no universal target — the right VaR is one that sits within the risk appetite the board has approved for the business. A number is only meaningful relative to the capital, earnings, and covenant headroom it is measured against.
What is the difference between VaR and expected shortfall?
VaR marks the threshold of the loss tail at a confidence level; expected shortfall (also called conditional VaR) measures the average loss in the scenarios that exceed VaR. Expected shortfall captures tail severity that VaR by construction ignores.
Does VaR replace stress testing?
No. VaR reflects normal market behavior drawn from historical or modeled distributions. Stress testing asks what a specific severe event — a Gulf Coast hurricane, a demand collapse — would do to the book. A robust program runs both.
How does Mobius help with VaR analytics?
Mobius's M(β)risk analytics quantify portfolio risk across physical and financial positions, giving CFOs and risk officers a defensible VaR and scenario framework tailored to real energy exposures rather than a generic model.
Mobius Risk Group pairs independent advisory with M(β)risk analytics so risk teams can measure, limit, and stress-test commodity exposure with numbers they can defend to lenders and boards.
Subscribe to receive the latest Mobius Research & updates