
August 26, 2026
Quick answer: Value at Risk (VaR) estimates the maximum loss a commodity portfolio is likely to suffer over a set time horizon at a chosen confidence level — for example, a 95% one-day VaR of $2M means losses should exceed $2M on only about 1 trading day in 20.
What does Value at Risk actually measure?
VaR compresses a portfolio's market risk into a single dollar figure defined by three inputs: a time horizon (one day, ten days), a confidence level (commonly 95% or 99%), and the distribution of possible price moves. For an energy or commodity book, that means modeling how much crude, natural gas, power, or feedstock exposure could move against you before a hedge or position is adjusted.
Because it is expressed in money at a stated probability, VaR gives CFOs, treasurers, and risk officers a common language for exposure that ties directly to a hedging policy. For the broader framework VaR sits inside, see our guide to commodity risk management for CFOs and treasurers.
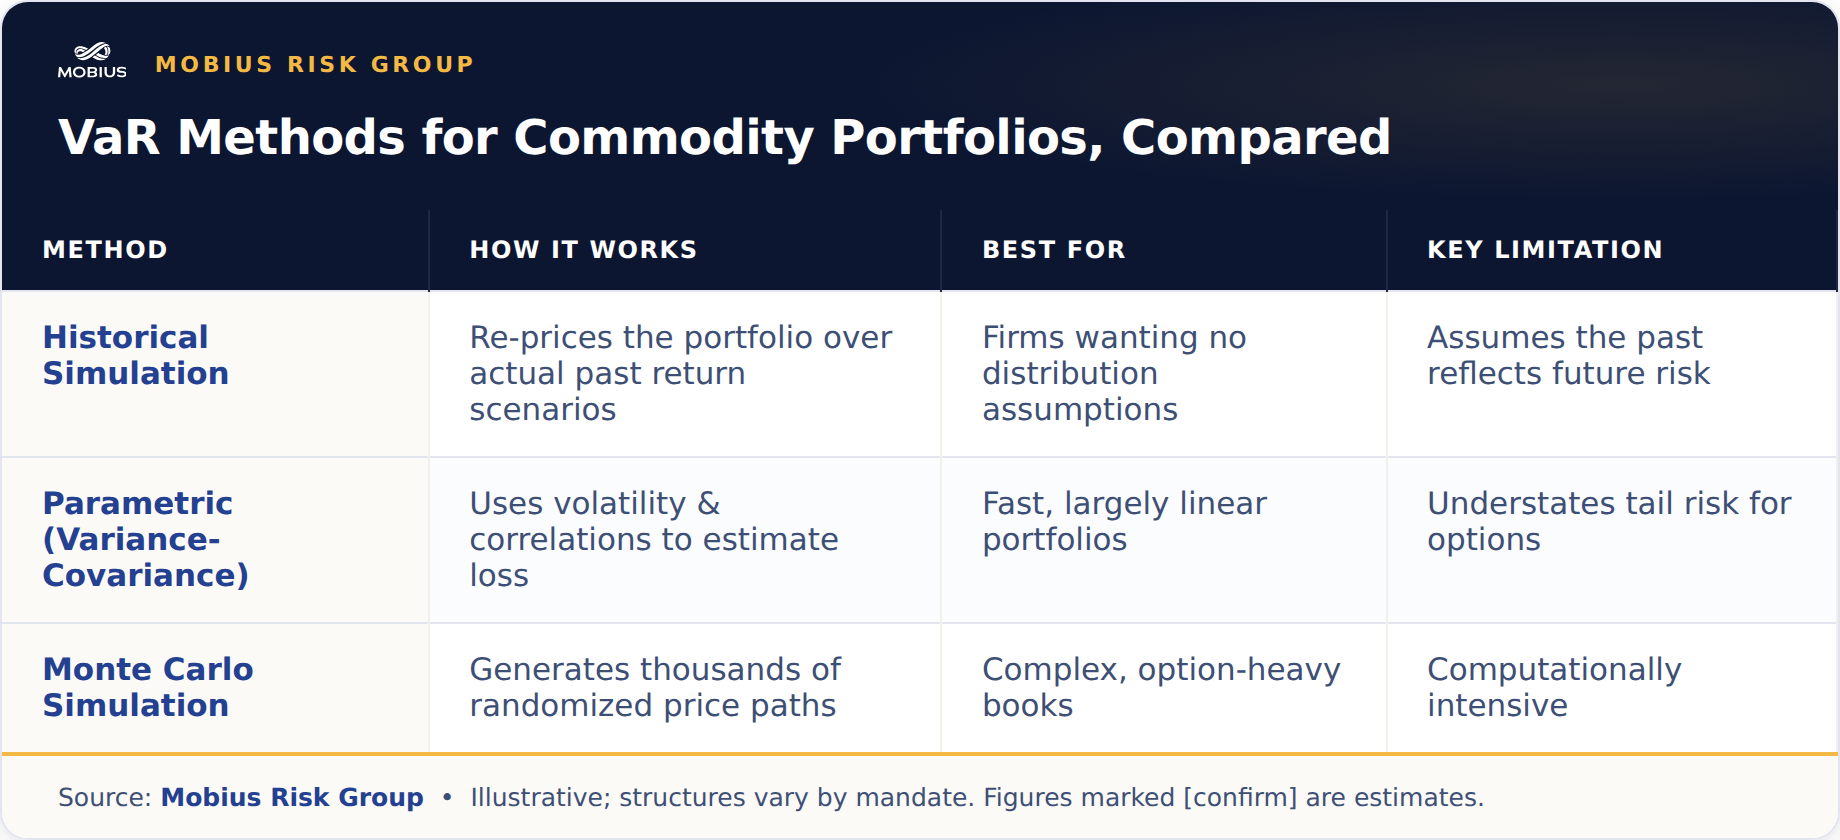
How is commodity VaR calculated?
There are three mainstream methods, and the right choice depends on how much optionality sits in the book.
Why is VaR different for commodities than for equities?
Commodity portfolios carry features that a simple equity VaR ignores: seasonality (natural gas winter risk), mean-reversion and term structure (contango/backwardation across the curve), basis risk between physical delivery points and the financial hedge, and frequent optionality from collars and three-way structures. A credible commodity VaR captures curve shape and correlations across tenors, not just a single spot price. Basis in particular can dominate real-world outcomes — see what basis risk is in natural gas hedging.
What are the limits of VaR — and what should sit beside it?
VaR says nothing about how bad losses get beyond the threshold. That gap is why disciplined programs pair VaR with Expected Shortfall (CVaR), stress tests (a hurricane-driven price spike, a 2008- or 2022-style shock), and scenario analysis tied to real market events. VaR is a monitoring tool, not a hedging decision on its own.
How does Mobius approach VaR for clients?
Mobius Risk Group runs portfolio analytics through M(β)risk, our quantitative risk engine, and RiskNet, our CTRM platform, so exposure, VaR, and mark-to-market are measured on the same position data that drives hedge execution and reporting. Because Mobius is an independent, unconflicted advisor — we don't take the other side of your trades — the analytics are built to inform your decisions, not to sell a position. For a wider view of the tooling, compare options in our commodity risk analytics platform buyer's guide.
Frequently asked questions
What is a good VaR confidence level for commodity portfolios?
Most programs report 95% for day-to-day monitoring and 99% for board- or policy-level limits. The right level is the one written into your risk policy and applied consistently.
Is a 95% one-day VaR of $1M a worst-case loss?
No. It means losses are expected to exceed $1M on roughly 1 day in 20; on those days the loss could be far larger. Expected Shortfall estimates that beyond-VaR average.
Does VaR replace stress testing?
No. VaR describes normal-market risk at a confidence level; stress tests and scenario analysis cover the tail events VaR is not designed to capture. Robust programs use both.
Can VaR account for basis and optionality?
Yes, if the model is built for it. Historical simulation and Monte Carlo capture non-linear payoffs and point-to-point basis better than a simple parametric approach.
Want VaR measured on the same data that runs your hedges? Talk with Mobius Risk Group about M(β)risk analytics and the RiskNet platform.
Subscribe to receive the latest Mobius Research & updates